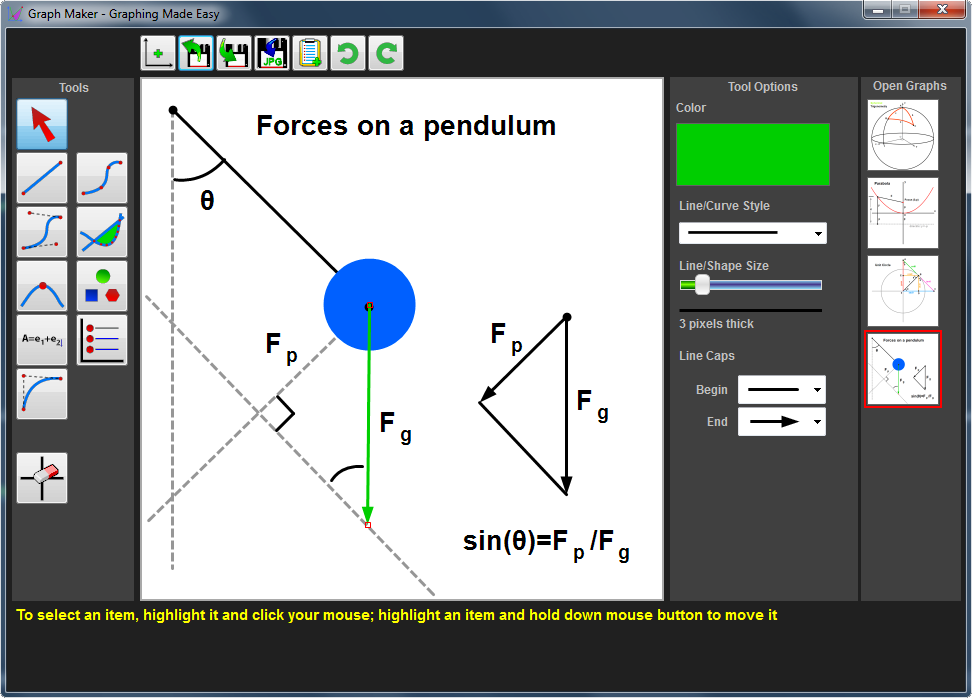
Usually graphing applications require the user to graph equations with formulas—not Graph Maker. It is more like a drawing program, but interactive! Once you draw a line, you can edit it and tweak how it is drawn.
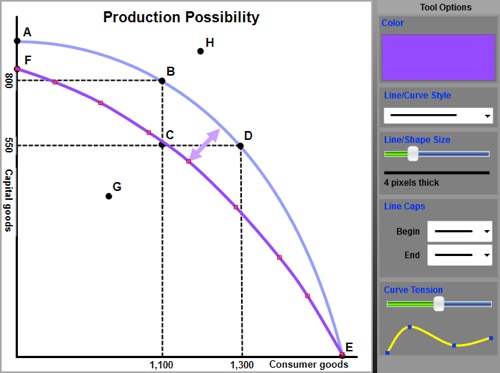
Graph Maker can be used to draw Economics graphs—you know, the Supply and Demand type. It can also be used to re-create mathematical diagrams, Chemistry diagrams, and anything else you can think of that is considered a graph.
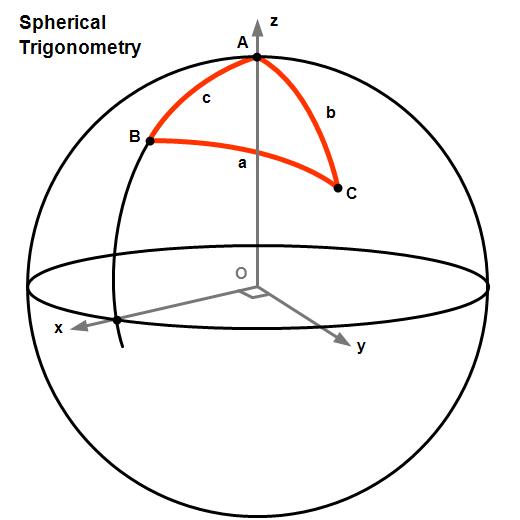
Using lines, curves, points, fill, geometric shapes, and text labels, you can draw any type of graph you like. With text label symbols, you can enhance your labels with greek letters and other mathematical symbology. There are two kinds of curves—Cardinal Splines, and Bezier Curves—each having unique characteristics and uses. Cardinal splines also have a curve tension feature that changes the way the spline is pulled over its control points, making for interesting effects.
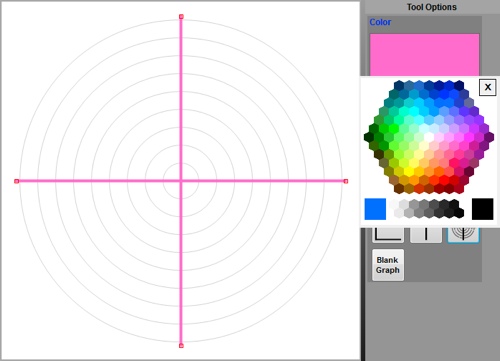
There are four types of graph templates: Blank, One Quadrant, Four Quadrant, and Polar. You can alter the size and color of the graph axes too!
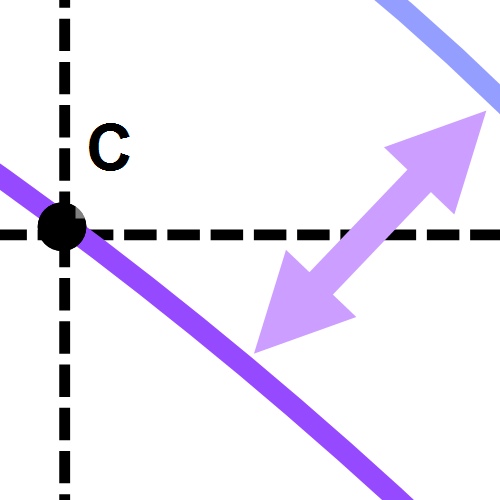
You can save graphs in native Graph Maker format or you can export them in a number of popular graphics formats too! JPEG, GIF, BMP, and TIFF are all standard image types. You can also export your graph in EMF, which is a vector format file. This is useful for exporting your graphs for printing purposes. The zoomed graph here depicts a vector export zoomed at over 400% to show the smoothing features of EMF exported graphs. Take a look at the gallery page to see what you can do with Graph Maker today.
Graph Maker has the tools to make your graphs pop in no time flat. Whether you like bling or are the conservative graphing type, Graph Maker can accommodate and help you get the job done with ease.